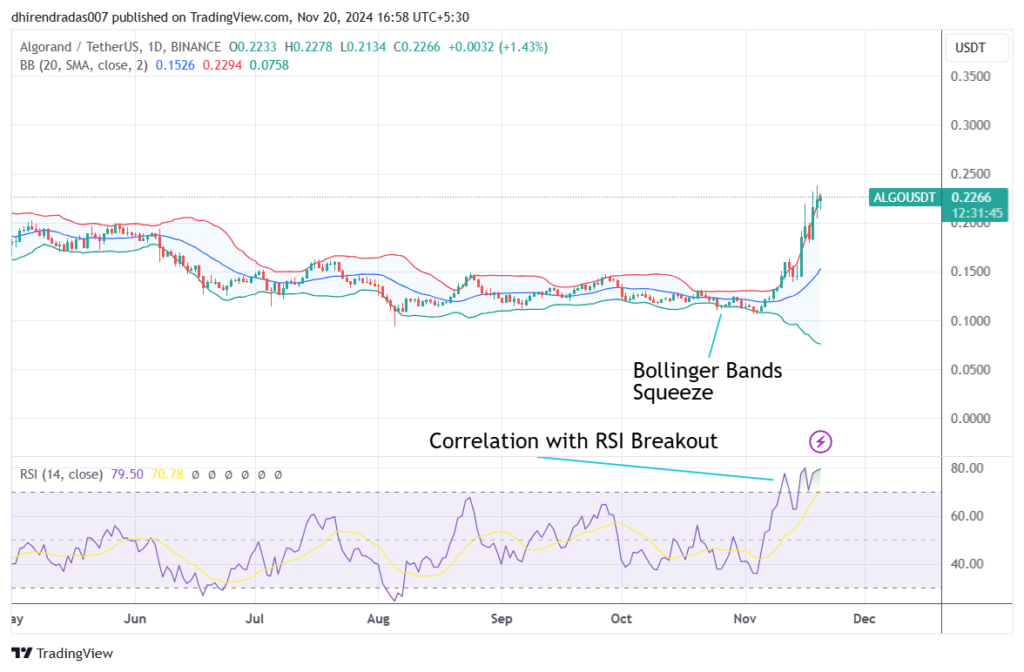
Bollinger Bands are a widely used technical indicator in cryptocurrency trading. They consist of two bands, upper and lower, and a moving average (N) which separates them over a standard deviation (a).
They were discovered by John Bollinger, a renowned financial analyst, in the 1980s, on whose name these bands have been named.
They help traders analyze the maximum and minimum price movements of an asset over time, providing critical insights into price volatility and potential market trends. Developed by John Bollinger, this tool is particularly effective for identifying periods of high and low volatility, making it a valuable resource for both novice and seasoned traders.
What Are Bollinger Bands?

Bollinger Bands consist of three key components:
- The Moving Average (N): This is the central line of the Bollinger Bands and serves as a median price value. Typically, a 20-day simple moving average (SMA) is used.
- Standard Deviation (a): Standard deviation measures the asset’s price volatility. It reflects how far the price deviates from the moving average over a specific period.
- Upper and Lower Bands: These are two bands of possible price deviations calculated from the moving average using the formulas below.
- Upper Band = N + (K * a)
- Lower Band = N – (K * a)
- Here, “K” is a constant typically set to 2, which determines the distance of the bands from the moving average.
The bands act as dynamic limits, capturing the asset’s price movement within an upper and lower range. This helps traders identify overbought or oversold conditions in the market.
Expansion and Contraction of Bollinger Bands
One of the distinctive features of Bollinger Bands is their ability to expand and contract based on market volatility:
- Expansion: During periods of high volatility, such as when the price experiences sharp increases or decreases, the bands widen. This expansion signals that significant price movements are occurring, often due to increased trading activity.
- Contraction: When volatility decreases, the bands become narrower. This contraction indicates a period of market stability with smaller price fluctuations.
What Is a Bollinger Band Squeeze?
A Bollinger Band Squeeze occurs when the bands contract significantly due to reduced price volatility. This creates a situation where the upper and lower bands appear to converge around the moving average.
The squeeze is often seen as a precursor to a sharp price movement, which can result in either a rally or a crash. While predicting the exact direction of the movement isn’t guaranteed, there are clues traders can use:
- Price Hugging the Lower Band:
If the price remains close to the lower band before the squeeze, it often signals an impending rally. - Price Hugging the Upper Band:
Conversely, if the price stays near the upper band, a crash is more likely.
It’s important to note that while these patterns occur frequently, they are not infallible. Traders should always combine Bollinger Bands with other technical indicators and market analysis tools to improve accuracy.
Why Do Bollinger Bands Contract Before a Squeeze?
The contraction of Bollinger Bands reflects a period of reduced price volatility. This happens when market participants are uncertain or waiting for new information, causing trading volumes to decline. Eventually, this low-volatility phase gives way to a burst of activity, leading to the sharp price movements that define a Bollinger Band Squeeze.
How to Use Bollinger Bands Effectively in Cryptocurrency Trading
Bollinger Bands should be typically used when volatility in the markets is either very high than in the past or very low. In such cases, the indicator becomes much more accurate. One such scenario is “Price Breakouts“.
To make the most of Bollinger Bands, traders should:
- Combine with Other Indicators: Use Bollinger Bands alongside tools like Relative Strength Index (RSI) or Moving Average Convergence Divergence (MACD) for better confirmation of trends.
- Monitor Volume: A surge in trading volume often accompanies price breakouts, providing further validation.
- Practice Risk Management: Always set stop-loss orders and manage position sizes to mitigate potential losses.
